Very close match. Final decision depends on buyer preference.
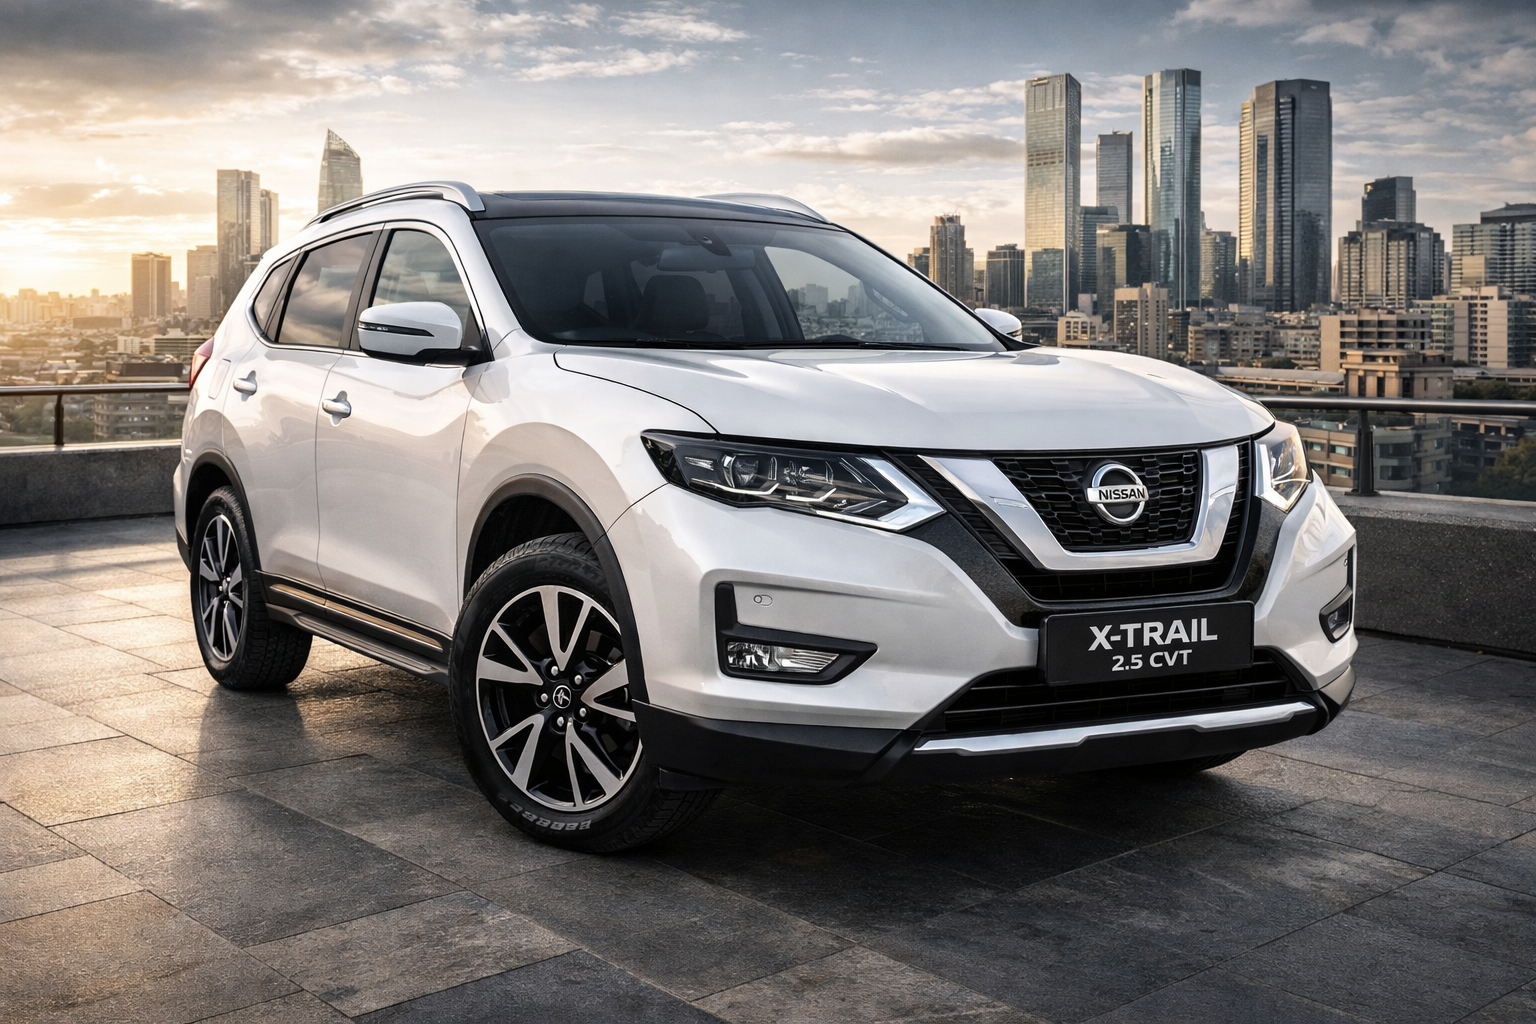
X-Trail
64
Executive Summary
Both RAV4 and X-Trail are extremely closely matched, making the final choice dependent on buyer preference.
Key Differences At A Glance
Performance
X-Trail
(+1)
Efficiency
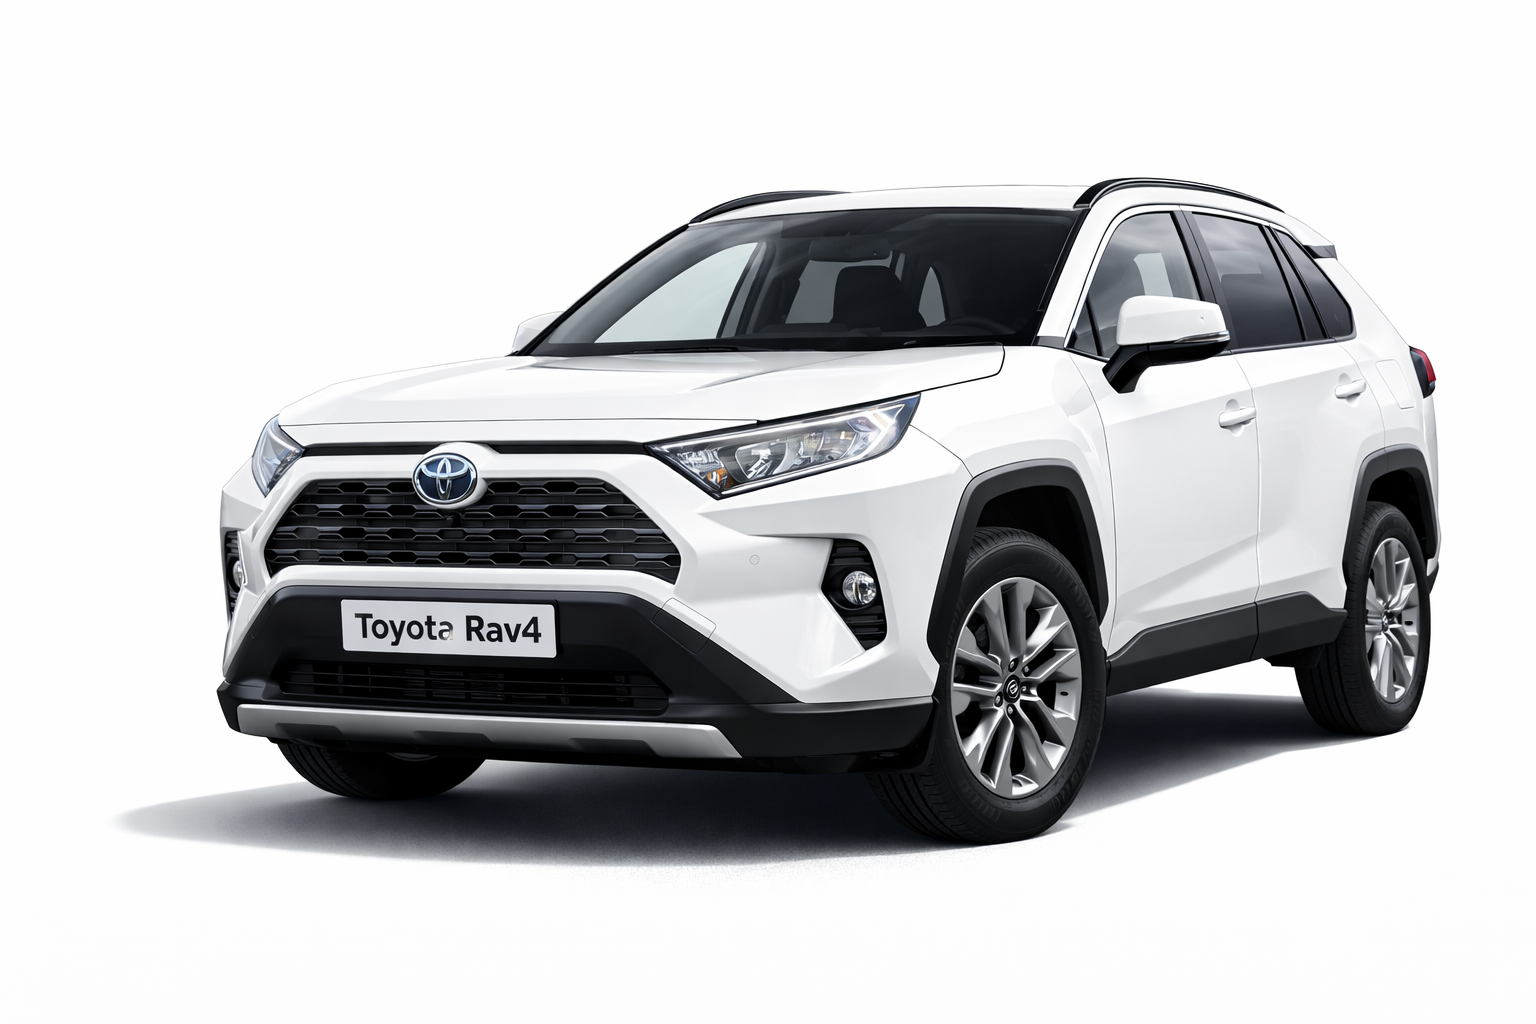
RAV4
(+8)
Safety
RAV4
(+2)
Practicality
Equal
Ownership
X-Trail
(+8)
Pros & Cons
🏆 Overall Winner
RAV4
Pros
Better fuel efficiency
Stronger safety package
Cons
Less powerful engine setup
Shorter warranty coverage
Best For:Fuel Efficiency
X-Trail
Pros
More powerful engine output
Better long-term ownership value
Cons
Lower fuel efficiency
Less comprehensive safety features
Best For:Highway Driving
Who Should Buy What?
RAV4
Buyers looking for better fuel efficiency
Families prioritising stronger safety equipment
X-Trail
Drivers who prioritise strong highway performance and overtaking power
Long-term owners valuing warranty and ownership peace of mind
Category Breakdown
RAV4
Performance – 10/20
Efficiency – 8/20
Safety – 20/20
Practicality – 15/20
Ownership – 12/20
X-Trail
Performance – 11/20
Efficiency – 0/20
Safety – 18/20
Practicality – 15/20
Ownership – 20/20
Full Specification Comparison
Spec
RAV4
X-Trail
Ground Clearance
195
210
Wheelbase
2690
2705
Length
4600
4680
Width
1855
1840
Height
1685
1725
Kerb Weight
1590
1635
Gross Vehicle Weight
2140
2230
Seating Capacity
5
5
Boot Space
580
565
Towing Capacity
1500
1800
Spec
RAV4
X-Trail
Engine
2.0L Naturally Aspirated Petrol
2.5L Naturally Aspirated Petrol
Engine Type
Inline 4 Cylinder DOHC
Inline 4-cylinder DOHC
Displacement
1987
2488
Cylinders
4
4
Valves per Cylinder
4
4
Power
127
126
Torque
203
233
Fuel System
Direct Injection
Direct Injection
Top Speed
185
200
0-100 km/h
9.9
10.2
Spec
RAV4
X-Trail
Transmission
CVT Automatic
X-Tronic CVT
Drive Type
4x2
4x2
Drivetrain Layout
Monocoque
Front Wheel Drive
LSD Available
Electronic
Electronic
Transfer Case
None
None
Spec
RAV4
X-Trail
Claimed Mileage
14.9
13.8
City Mileage
10
10.5
Highway Mileage
14
15.2
Fuel Tank Capacity
55
60
Emission Standard
Euro 5
Euro 6
Spec
RAV4
X-Trail
Airbags
7
6
ABS
Standard
Standard
Electronic Stability Control
Standard
Standard
Traction Control
Standard
Standard
Hill Descent Control
Standard
Standard
Child Safety Lock
Standard
Standard
ISOFIX Mounts
Standard
Standard
Brake Assist
Standard
Standard
Tyre Pressure Monitor
Standard
Standard
Engine Immobiliser
Standard
Standard
Spec
RAV4
X-Trail
Cruise Control
Standard
Standard
Adaptive Cruise Control
Standard
Available
Lane Keep Assist
Standard
Available
Blind Spot Monitoring
Optional
Standard
Rear Cross Traffic Alert
Optional
Standard
Parking Sensors
Rear
Front and Rear
Rear View Camera
Standard
Standard
360 Degree Camera
None
Standard
Autonomous Emergency Braking
Standard
Standard
Spec
RAV4
X-Trail
Seat Material
Fabric
Premium Cloth
Seat Adjustment
Manual
Driver Height Adjustable
Heated Seats
None
Front Heated
Ventilated Seats
None
None
Steering Type
Power Assisted
Electric Power Steering
Steering Adjustment
Tilt and Telescopic
Tilt and Telescopic
Ambient Lighting
Standard
Soft White Ambient Lighting
Spec
RAV4
X-Trail
Climate Control
Dual Zone Automatic
Dual-zone Automatic
Power Windows
All Windows
One-touch All
Keyless Entry
Smart Key
Smart Key
Push Button Start
Standard
Standard
Wireless Charging
None
Available
Sunroof
None
Panoramic Glass
Electric Tailgate
None
Power Operated
Spec
RAV4
X-Trail
Infotainment Screen
8-inch Touchscreen
9-inch Touchscreen
Apple CarPlay
Standard
Wireless
Android Auto
Standard
Wireless
Bluetooth Connectivity
Standard
Standard
Number of Speakers
6
8
Navigation System
Built-in
Built-in Navigation
Spec
RAV4
X-Trail
LED Headlamps
LED
LED Projector
Daytime Running Lamps
LED
LED
Fog Lamps
Front
Front and Rear
Roof Rails
Black
Silver
Alloy Wheel Design
17-inch Alloy
18-inch Dual-tone Alloy
Spec
RAV4
X-Trail
Approach Angle
18
19
Departure Angle
20
23
Wading Depth
400
400
Terrain Modes
Normal Eco Sport
Standard Drive Modes
Locking Differential
None
Electronic
Spec
RAV4
X-Trail
Tyre Size
225/65 R17
225/60 R18
Wheel Type
Alloy
Alloy
Front Brake Type
Ventilated Disc
Ventilated Disc
Rear Brake Type
Disc
Disc
Spec
RAV4
X-Trail
Front Suspension
MacPherson Strut
Independent Strut
Rear Suspension
Double Wishbone
Multi-link
Chassis Type
Monocoque TNGA
Monocoque
Spec
RAV4
X-Trail
Service Interval
15000 km / 12 months
15000 km / 12 months
Approx Service Cost
Moderate
Moderate
Battery Warranty
Not Applicable
2 Years
Spec
RAV4
X-Trail
Warranty Years
3
6
Warranty Kilometers
100000
150000
Roadside Assistance
3 Years
6 Years
Spec
RAV4
X-Trail
CO2 Emissions
173
208
Start Stop System
Standard
Standard
Hybrid System Type
None
None
Final Verdict
In structured scoring, RAV4 emerges as the stronger overall package.
However, X-Trail may appeal to buyers prioritising different factors.
Ultimately, the right choice depends on your driving priorities in South Africa.